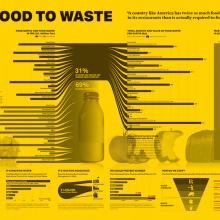
Karen Cheng (co-authored with Adam Drewnowski and Jennifer Otten). "Infographics And Public Policy: Using Data Visualization To Convey Complex Information." Health Affairs Vol. 34, No. 11 (November 2015): 1901–1907.
Abstract from publisher's article webpage:
Data visualization combines principles from psychology, usability, graphic design, and statistics to highlight important data in accessible and appealing formats. Doing so helps bridge knowledge producers with knowledge users, who are often inundated with information and increasingly pressed for time.

